Hi Bower,
The study is about 76 introgression lines. The correlation is Pearson correlation.
From the net :
https://statistics.laerd.com/stata-t...sing-stata.php
Quote:
|
A Pearson's correlation attempts to draw a line of best fit through the data of two variables, and the Pearson correlation coefficient, r, indicates how far away all these data points are to this line of best fit (i.e., how well the data points fit this new model/line of best fit). Its value can range from -1 for a perfect negative linear relationship to +1 for a perfect positive linear relationship. A value of 0 (zero) indicates no relationship between two variables. For example, you could use a Pearson's correlation to understand whether there is an association between exam performance and time spent revising (i.e., your two variables would be "exam performance", measured from 0-100 marks, and "revision time", measured in hours). If there was a moderate, positive association, we could say that more time spent revising was associated with better exam performance. Alternately, you could use a Pearson's correlation to understand whether there is an association between length of unemployment and happiness (i.e., your two variables would be "length of unemployment", measured in days, and "happiness", measured using a continuous scale). If there was a strong, negative association, we could say that the longer the length of unemployment, the greater the unhappiness.
|
There is an example of a correlation of 0.4 representing a chart with the two parameters :
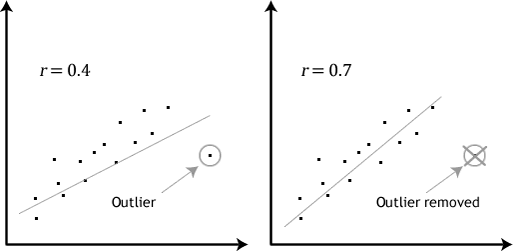
So it not means that there is a link 40% of the time (my mistake), but if you plot your plants by fruit sugar and leaf complexity, measures will tend to follow the linear curve x = 0.4y (if i've understood correctly this time).